

§ 6.c.2 · charts

A chart is a comparison made visible.

Across 4,934 charts read by the corpus tagger, only one in four lands a strong takeaway. The rest decorate.

Corpus argumentative power n = 4,934 charts · 67 Ralph iterations
  1. Absent literally no takeaway possible — should not have been a chart
  2. Weak data shown, takeaway missing — decorative wallpaper
  3. Medium the takeaway is there, but the reader has to work for it
  4. Strong one comparison, made sharp — the reader leaves with a position they can repeat
The forgettable charts show data. The rare ones isolate one comparison the audience couldn't make in their head.
Tagged sample · 67 Ralph iterations · 14 rules promoted
02 the choice

Two charts. One choice.

Both ship data. Only one isolates a comparison the audience couldn't make in their head. Read each one cold; what do you walk away with?

Decorate data shown · comparison vague
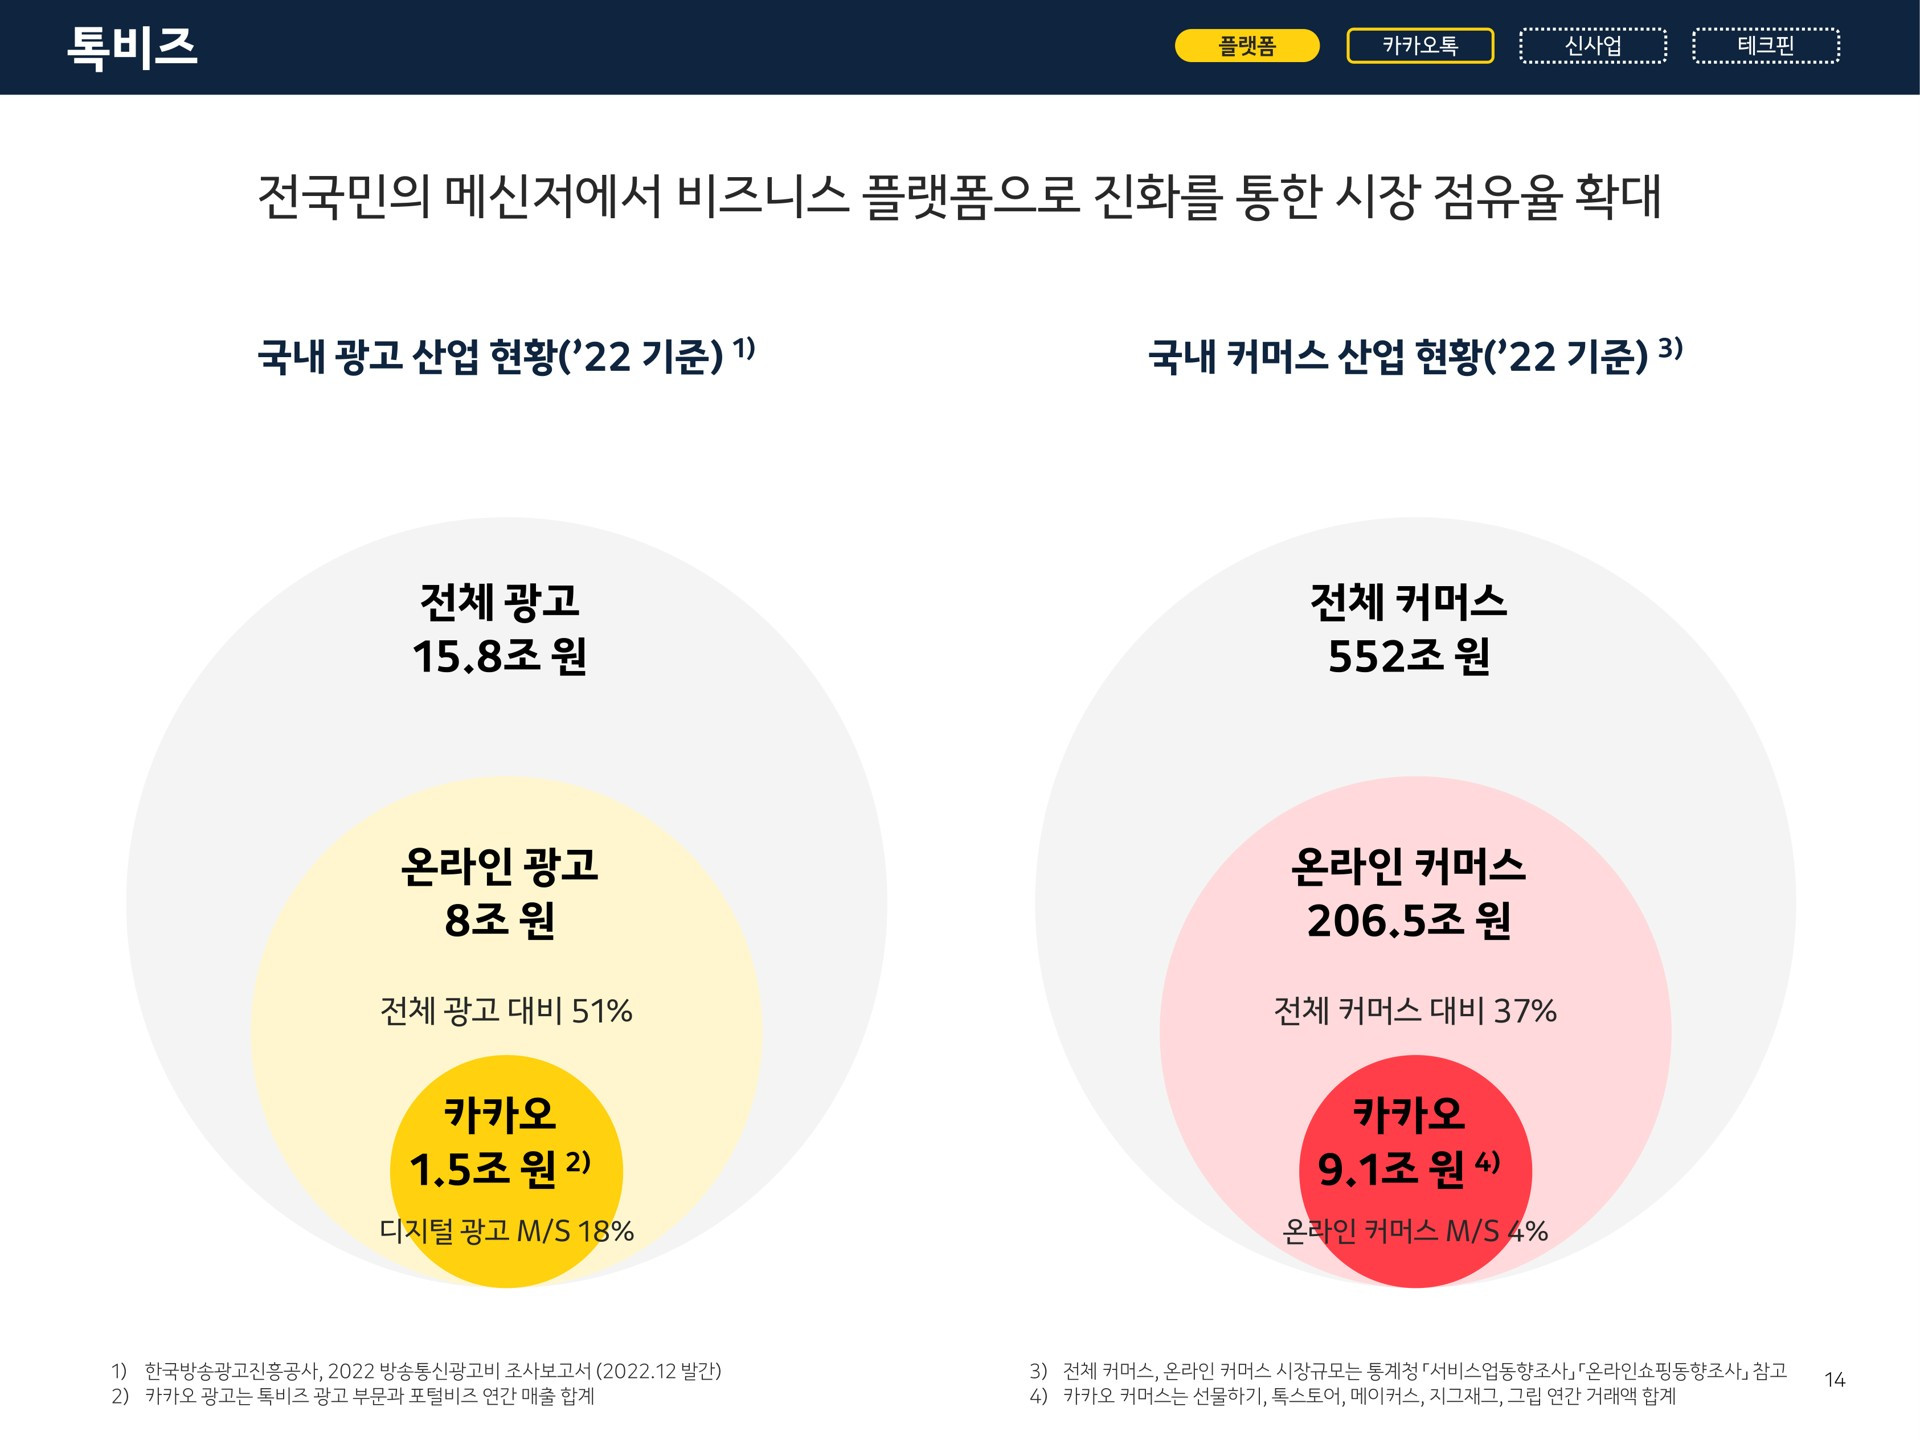
A pair of nested-circle charts arguing market share
  • Form: nested proportional circles × 2
  • Comparison made: ambiguous — area encoding for ratios
  • Anti-pattern: dimensional vagueness · mismatched encoding

Reader leaves with: "Kakao operates in two markets" — but cannot remember which is bigger.
Argue one comparison · sharp · sourced
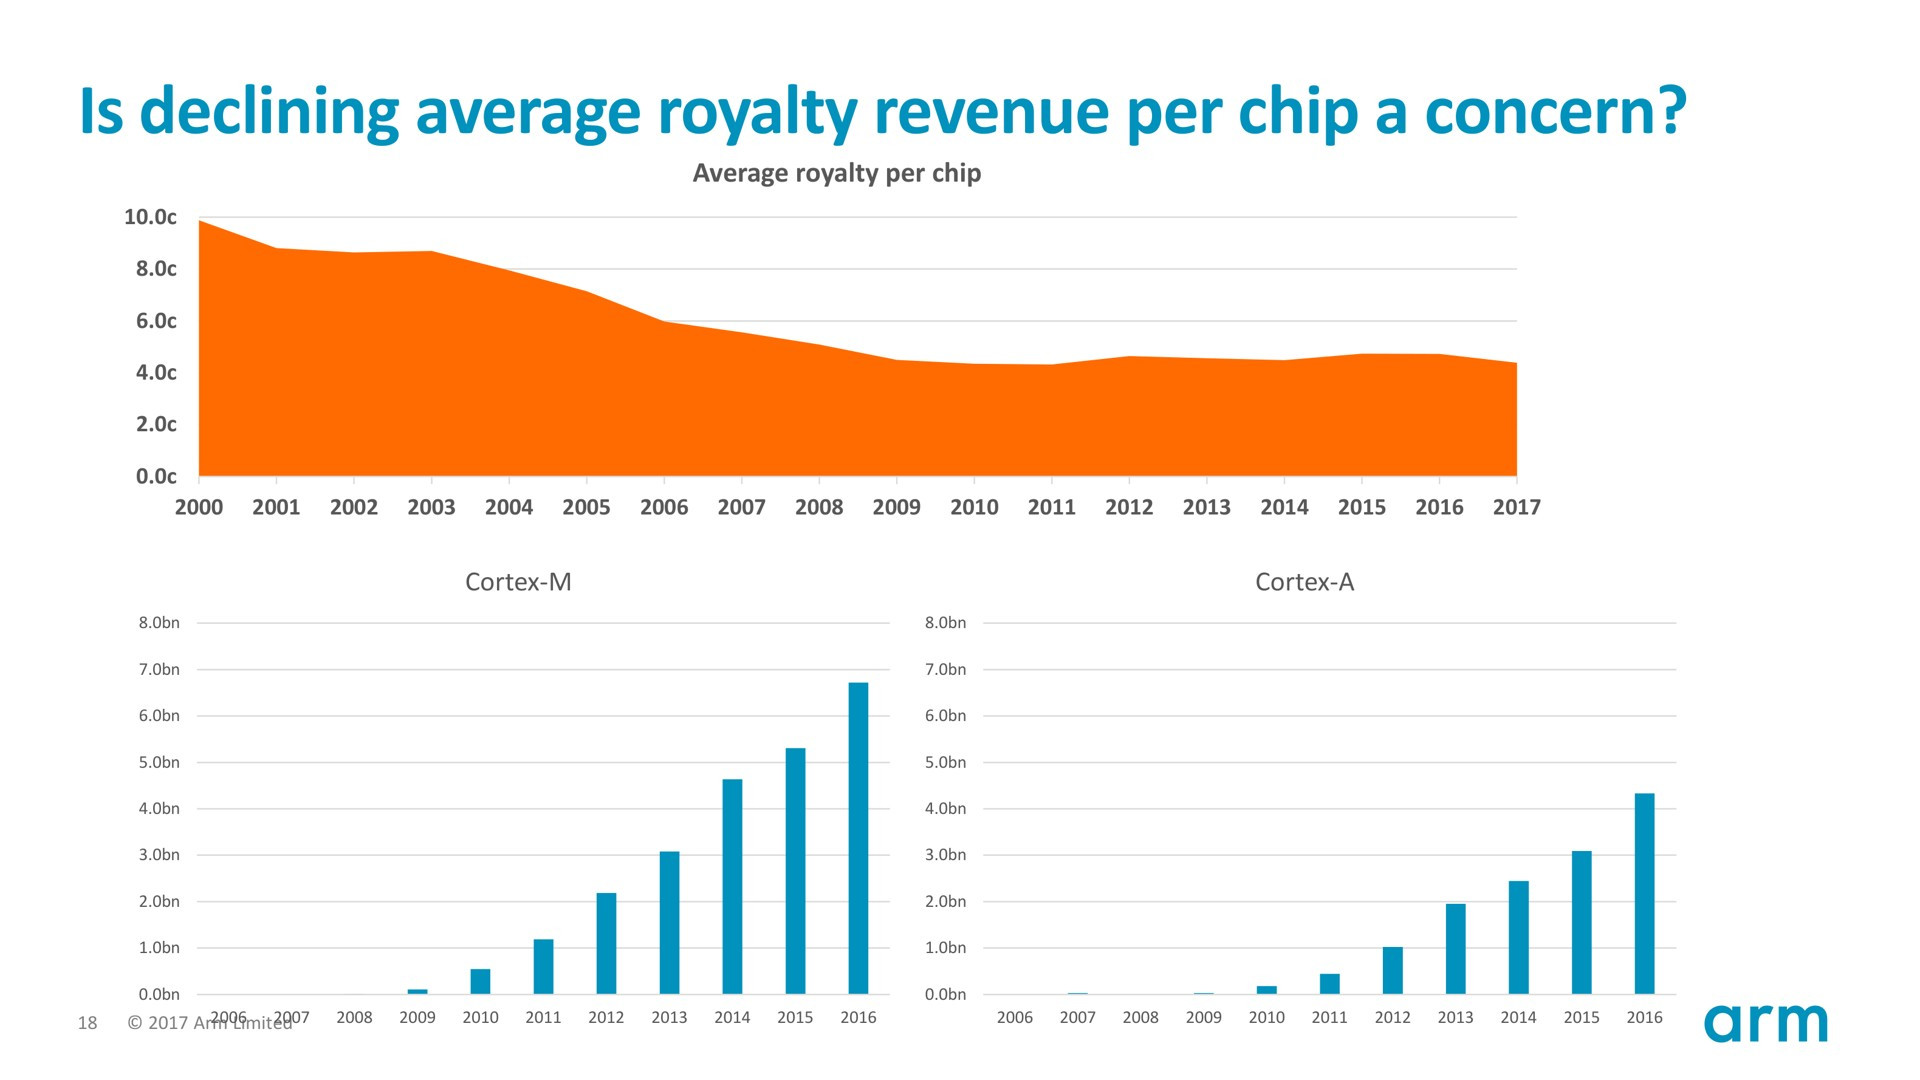
Grouped bar chart contrasting Arm royalties against peers
  • Form: grouped bar — entity × category
  • Comparison made: royalty multiple, two categories
  • Primitive: highlight palette · source line · numeric callouts

Reader leaves with: "Arm charges 3-5× the per-unit royalty of every peer."
Same data layer, two different decisions about what the eye should grab.
corpus.charts · samples 0827 + 0002 · anonymised
03 six jobs

56 forms. Six jobs.

Bar, line, donut, waterfall — those are forms. Beneath the 56 canonical types, every chart is doing one of six jobs. Pick the job first; the form follows.

Evolve 31%

one thing changing over time

forms · line · area · bar-vertical (time series)

Compare 15%

A vs B at a single moment

forms · bar-grouped · bar-vertical · bubble

Decompose 15%

parts of a whole

forms · donut · pie · bar-stacked · waterfall

Rank 6%

order by magnitude

forms · bar-horizontal

Position 3%

where on a 2D landscape (x × y)

forms · scatter · bubble · matrix-2x2

Distribute 2%

shape of a distribution

forms · histogram · box-plot

Pick a pie for a rank job and the comparison dies before it lands.
04 anatomy

The chart, componentised.

The marks ARE the chart; five more primitives carry the editorial load; seven more sharpen it. Toggle Advanced to see the full anatomy — including four editorial concepts the corpus tagger does not yet detect.

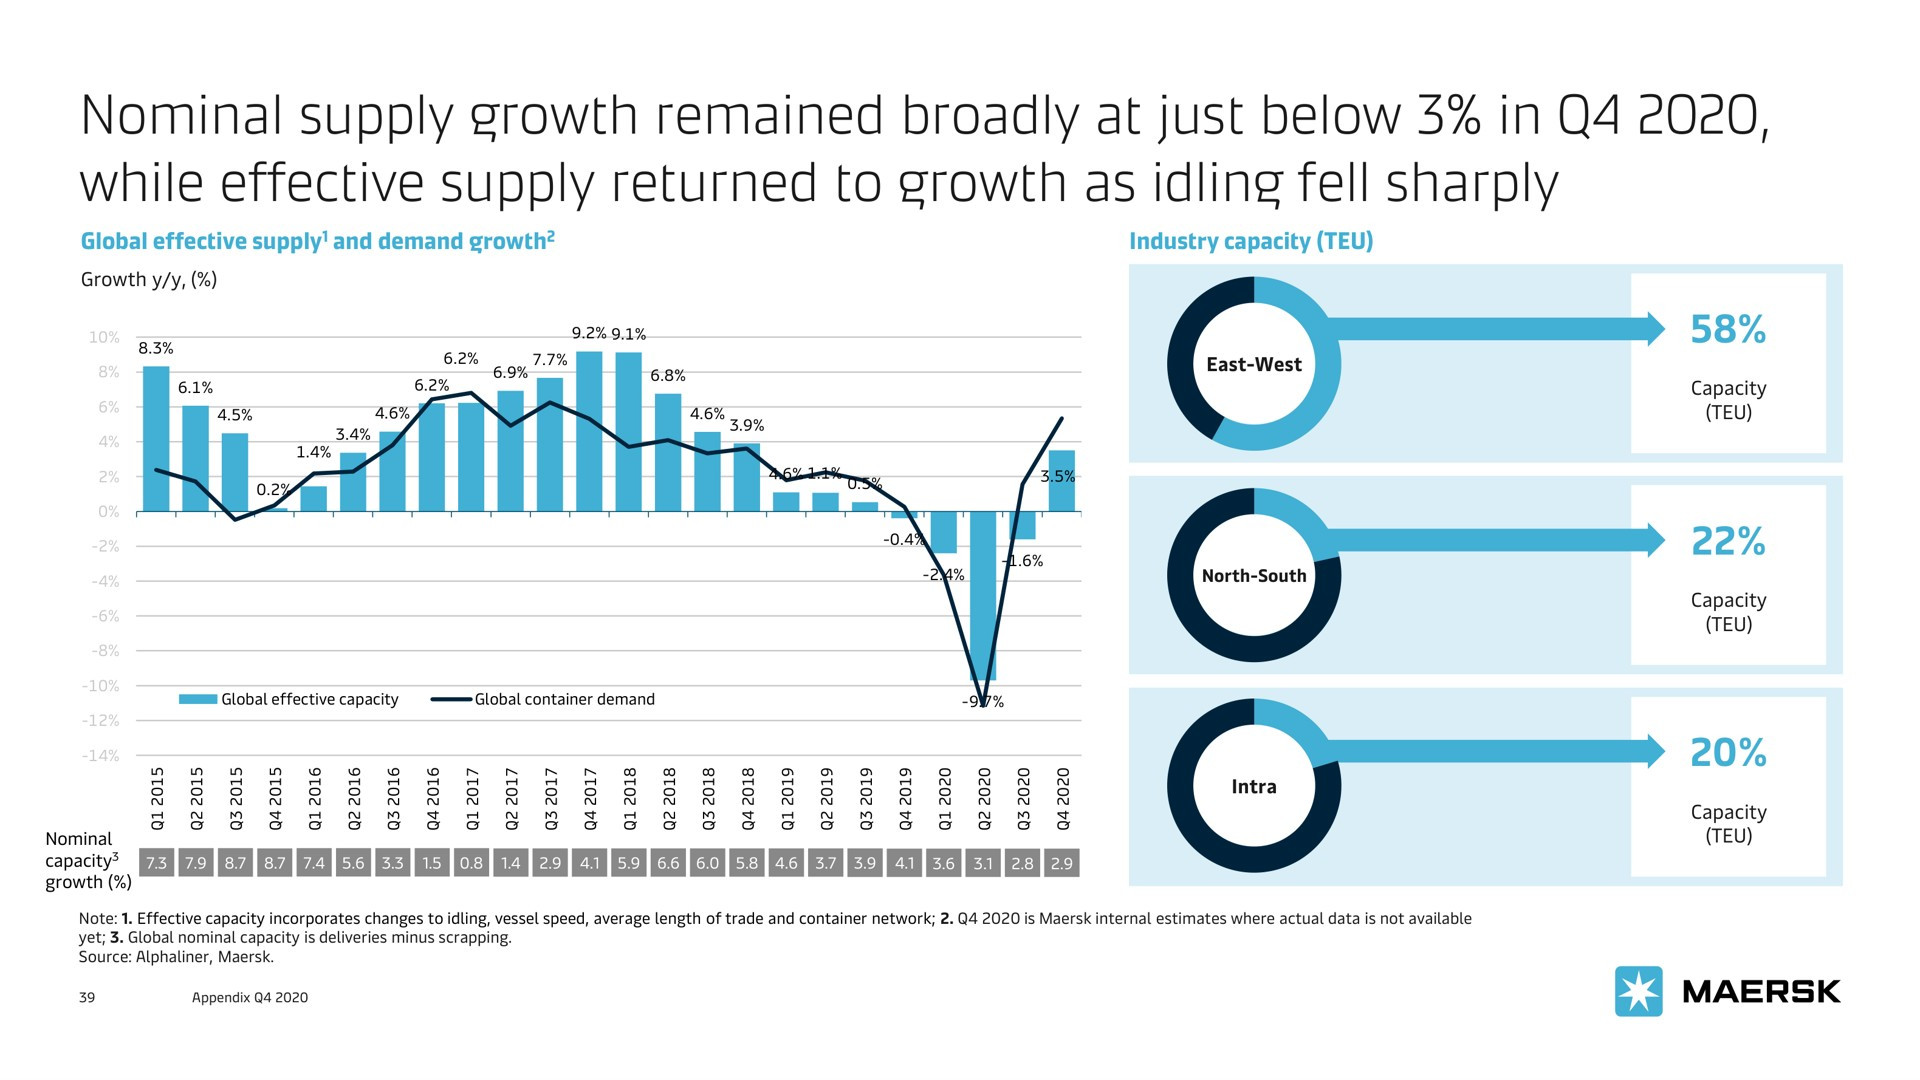
Revenue compounded 75% CAGR — $32M to $296M Quarterly revenue with growth-rate trend overlay, 7-quarter run. Revenue ($M) Trend Revenue ($M) 0 80 160 240 320 median = 105 32 48 71 105 152 214 296 +72% vs median Q1Q2Q3Q4Q5Q6Q7 Quarter (FY-2024 onward) Source: Anlak Studio canonical illustration · n = 7 quarters · CAGR computed Q1 → Q7. 1 2 3 4 5 6 7 8 9 10 11 12 13
Forgettable charts ship two of these. Memorable ones ship eight. The primitives are not optional — they are the chart.
13 components · 1 core · 8 LLM-detected · 4 editorial · exemplar from 0373-maersk
05 catalog

Pick the job. The shape follows.

56 canonical types, organised by the job each one is hired to do. Top three forms per job; the full reference lives at /insights/charts/types.

Evolve

how did it change over time?

30.5%
  • bar-vertical bar
  • bar-stacked-vertical bar
  • column-vertical bar

Compare

A vs B at one moment?

14.8%
  • bar-vertical bar
  • bar-horizontal bar
  • bar-stacked-vertical bar

Decompose

parts of a whole?

14.6%
  • bar-stacked-vertical bar
  • bar-stacked-horizontal bar
  • area-stacked time

Rank

who is biggest, then next?

5.6%
  • bar-vertical bar
  • bar-horizontal bar
  • bar-grouped-horizontal bar

Position

where on a 2D landscape?

2.5%
  • bubble corr
  • matrix-2x2 spec
  • venn spec

Distribute

shape of the distribution?

2.3%
  • bar-range bar
  • pie comp
  • donut comp

Forecast

projected vs known?

1.8%
  • line time
  • scatter-with-trendlines corr

Flow

what moves where?

0.2%
  • sankey flow
  • flow-diagram flow
  • funnel flow

System

how do the parts connect?

1%
  • flow-diagram flow
  • gantt flow
  • timeline-chart flow
Same data, different job, different chart. Form is downstream of job.
20 of 56 canonical types · % = share of tagged corpus
01 / 05